Stock market volatility is an overused phrase, thanks to the roller coaster ride stock investors have been on lately. In recent years, the concept of volatility has been the subject of much discussion, as pundits argue whether it is good or bad for the market.
So much so, in fact, that you can place bets directly on it by purchasing shares in a VIX ETF Fund. What does it mean for the average investor, and is it good or bad? Should you pay attention to it, or is it just one more item to add to the noise of the market?
VIX, VXN and Other Stock Market Volatility Indexes
What is the VIX? (SP500)
The VIX is simply just the ticker symbol for the Chicago Board of Options Exchange (CBOE) market volatility index and what it does is it measures the implied volatility of S&P 500 index options.
You may hear it referred to as the fear index or the fear gauge but all it’s simply doing is measuring implied volatility but generally speaking:
The more volatile the market is the higher the VIX is and the market starts to become more volatile more erratic particularly near 20 for the S&P then the VIX started to increase in price near 30 more notably during the market crash.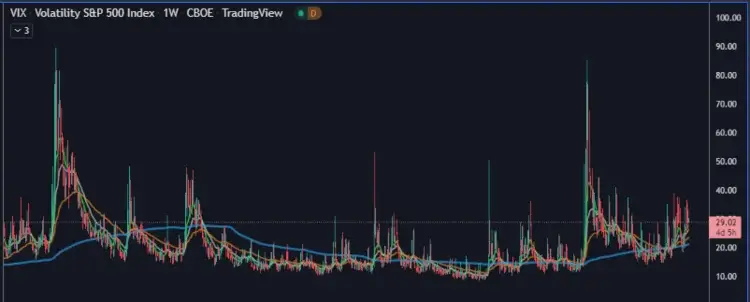
Investors refer to the CBOE Volatility Index, aka VIX, as the fear index, because they mistakenly believe it represents the amount of negative sentiment among market participants. What it actually represents is the implied stock market volatility of S&P 500 futures options, or the expected amount of future unpredictability. This may sound like an oxymoron, because it represents the expected amount of unexpected behavior. The VIX goes up when predictability goes down. In other words, the VIX is high when expectations of market direction are unsure.
Market participants like smooth and steady performance. They are easily spooked by something they don’t expect and spooked investors tend to run first, then ask questions later. Because of this, stock market volatility is something investors dislike. When it becomes uncomfortably high, it precipitates a flight of capital out of risky assets into safe assets such as gold.
What is the Fear and Greed Index?
A secondary measure, which combines the VIX with several other tools that gauge investor sentiment, is the CNN Money Fear and Greed Index, reflecting extreme fear (red color) to showing a solid green of extreme greed. A graph of the index over time shows how quickly and dramatically sentiment can change.
- Visit: Fear and Greed Index on CNNMoney site.
What is the VXN? (Nasdaq QQQ)
(To pronounce it more fluently, traders call it VIXEN)
VXN allows us to have a measure of the expected risk at any time for any investments made in tech stocks (Nasdaq). In response to these variations, we can set up an aggressive or defensive strategy depending on whether we are risking less or more than before.
Why is Stock Market Volatility Presently High?
The stock market is a volatile place, with prices rising and falling rapidly. This volatility has been increasing in recent years, and some experts are trying to figure out why. There are a few possible explanations:
First, at election times fear and uncertainty about the future can make markets go haywire. Second, we live in a world where technology changes rapidly. This can lead to big swings in stocks because investors don’t know what will happen next with new companies or products. Finally, there are many new players in the market. Many people who are not very good at acting are trying to make it in the markets and can cause big swings.
The Role of the Federal Reserve (FED)
The Fed can strongly influence lower or higher market volatility. The Federal Reserve has a tool that can calm investors: quantitative easing (QE). This type of policy injects money from the market so that companies can borrow money to hire more workers or invest in infrastructure. In other words, the economy grows. Not everything is positive with QE; this policy also brings inflation risks.
On the other hand, the FED can apply a quantitative tightening (QT) policy to take money from the market, producing the opposite effect of a downturn in the economy. All this would increase market volatility (fear). – See more: What is the Fed’s quantitative tightening (QT)?
For example: the Federal Reserve announced in December 2013 that it would begin to taper its monthly treasury bond purchases; this process has been known as “quantitative easing (QE),” and it has been in place since the fiscal crisis of 2007. In December, the Fed observed that the country’s economy seemed to be making some headway and that it felt the need for its stimulus would continue to diminish.
Investors took heart that this meant the economy was recovering at a decent pace, and therefore they felt more confident, so they began to position themselves for a strong market to accompany the strengthening economy.
Stock Market Volatility as Buy Signal?
One thing to note, however, is that when the VIX spikes higher, the market tends to fall:
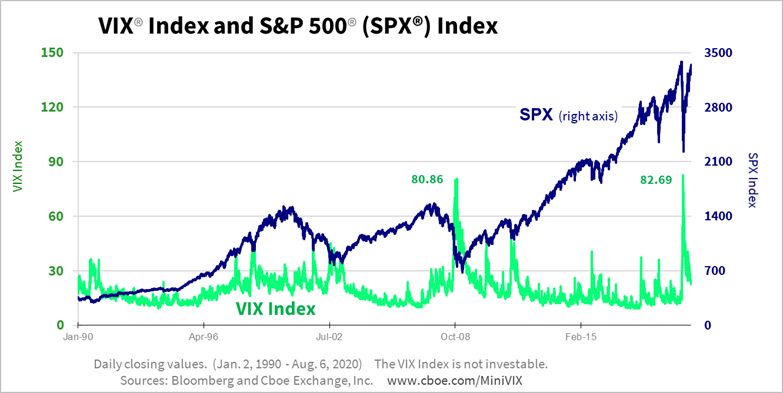
Therefore, investors could consider a higher reading of the VIX, combined with a fall in the markets a buying opportunity for the brave. Whatever you choose to do, be sure to arm yourself with information on investment topics like stock market volatility by taking an online investing course, such as the Investing Fundamentals Course.